|
|
Array configuration:
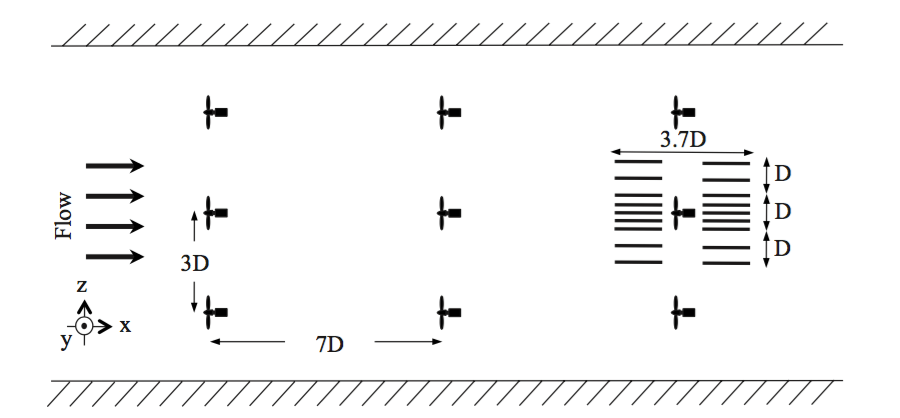
- 3x3 aligned array of model turbines
- Separations in array: 7D in streamwise direction, 3D in spanwise direction.
- Target turbine: middle turbine in 3rd row.
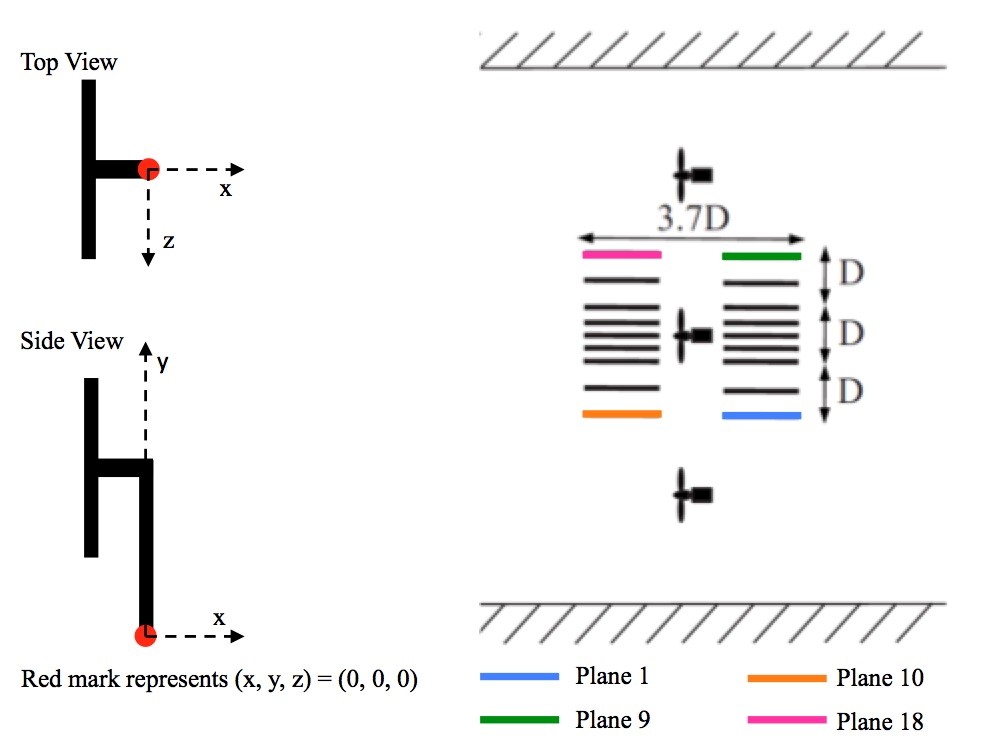
Top View

Side View:

Rotor Characterization:
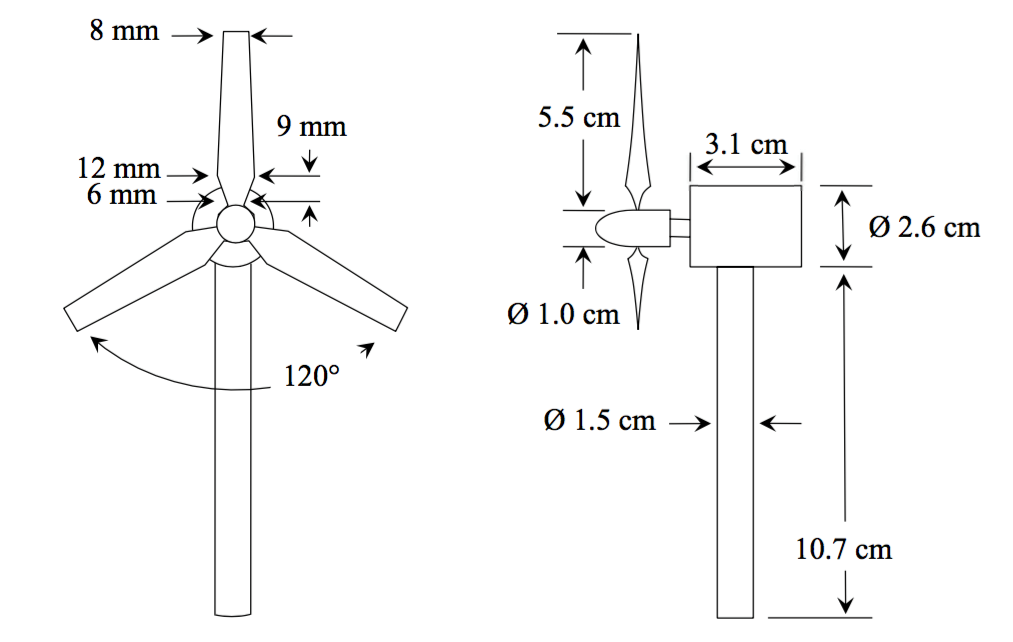
- Geometry of rotor, nacelle and tower (see schematic):

- Rotor diameter: D=12 cm
- Rotors were cut from sheet metal and twisted, from 15° at the root to 10° at the tip, as measured from plane normal to flow. The blade thickness is uniform and equal to 0.48 mm.
- The target turbine operated Omega = 4890 rpm.
- The only aerodynamic characterization of rotor available for this experiment is the induction factor based on operating conditions of the target turbine. It was obtained from integral of measured mean velocity upstream and downstream of rotor. a= 0.5(1 − U_back / U_front) is used, where Ufront and Ufront are average streamwise velocities upstream and downstream of the wind turbine rotor, inside a streamtube that passes through the rotor disk. These velocities were evaluated directly from the PIV measured data. The resulting induction factor was a=0.087.
Inflow:
- Active grid followed by vertical strakes.
- Wind tunnel test section: 0.9m x 1.2m x 10m.
- Distance between ground plate to tunnel upper wall: 0.7m.
- Ground plate covered by 24-grit aluminum oxide sand paper. The ten-point height or the average of the five highest peaks and the five deepest valleys yield a value for the roughness height of k = 1.5 mm.
- Hot-wire measurements of vertical profiles at x=2.9 m from the leading edge of bottom plate and 0.1 m upstream of the wind turbine array.
- From measured shear stress: u*=0.48 m/s. Using k=0.4, the fitted roughness scale is y0=0.33 mm.
- Profiles of mean velocity U(y) [Fig. 6 in Cal et al., 2010] and Reynolds stresses (-uv,uu, vv,ww) Link »
Available data:
- Velocity data in a region extending between 1.85D to 0.52D upstream of target turbine and between 0.52D to 1.85D downstream of target turbine.
- 18 planes of Stereo PIV data, 9 in front, 9 behind target turbine.
- Each PIV data plane has size 16x16 cm2 with 128x128 pixel interrogation regions and 50% overlap; thus PIV vectors are separated by 2.5mm.
- 2000 samples were taken at each of the 8 upstream planes. 12000 samples for the 8 downstream planes. Acquisition was done at a rate of 7 Hz (not time resolved).
- Folder available for download below: On each of the 18 planes, data include mean velocities U, V, and W and uu, vv, and uv Reynolds stresses as function of x, y . [Figs. 9 and 10 in Cal et al., 2010] on the 64 x 64 PIV grid.
Data planes organization and naming:

Data contained in 18 asci files with columns of x,y,z,U,V,W,uu,vv,uv as function of x,y on 18 z-planes, in a compressed folder:
Download data folder: Windfarm-stats-PIV.zip |
![]()


